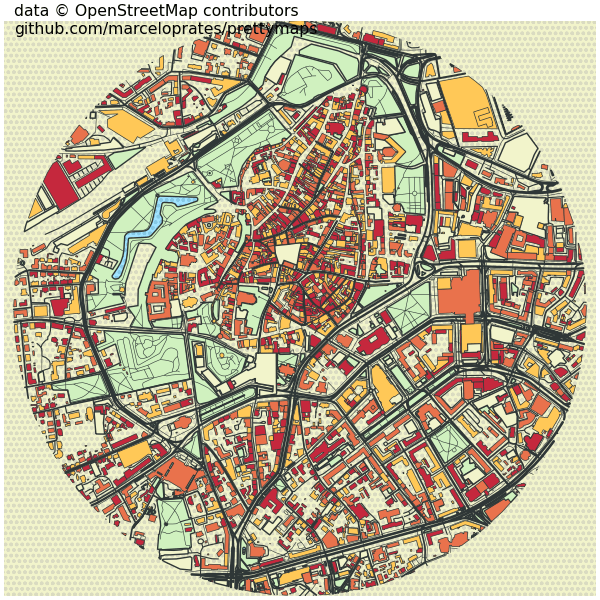
Last year I came across an article on Hacker News advertising a new project called prettymaps. It's largely the work of Marcelo de Oliveira Rosa Prates and Christoph Rieke and allows you to specify a location by its name and, using some great default styles, will generate a map of that area in PNG format. Below is an example depicting Tallinn's Old Town.

The project only contains 425 lines of Python due to intense 3rd-party package use.
The map data is collected from OpenStreetMap using the OSMnx library. This library itself is made up of only 3,700 lines of Python as its relying on NetworkX. NetworkX wraps up functionality relating to complex networks and is made up of 78K lines of Python. NetworkX is largely the work of Aric Hagberg, an applied mathematician at the Los Alamos National Laboratory as well as Jarrod Millman who was once the release manager for both NumPy and SciPy.
Rendering is handled by vsketch, a project made up of 4.6K lines of Python and is based largely on the efforts of Antoine Beyeler, an entrepreneur based in Switzerland.
In this post, I'll walk through generating the following rendering of Tallinn's Old Town.
Installing Prerequisites
I'm using a fresh install of Ubuntu 20.04 LTS with an Intel Core i5 4670K clocked at 3.4 GHz, 16 GB of DDR3 RAM and 250 GB of NVMe SSD capacity.
Below I'll install Python and some build tools used throughout this post.
$ sudo apt update
$ sudo apt install \
    jq \
    python3-virtualenv
I'll set up a Python virtual environment and install a few packages.
$ virtualenv ~/.pretty
$ source ~/.pretty/bin/activate
$ python3 -m pip install \
    prettymaps \
    typer \
    git+https://github.com/abey79/vsketch.git
As of this writing, the Python requirements file for prettymaps pins to OSMnx version 1.0.1 which is out of date. The code in this post won't run without an update to a newer version. I found version 1.2.1 to run without issue.
$ python3 -m pip install \
    osmnx==1.2.1
Mapping the Old Town
The following is a script that you can call from the command line. It allows you to pick a location based on its name and optionally you can control the radius in meters around the centre point as well as the size of the rendering.
$ vi pretty.py
import uuid

import typer
import vsketch
from   prettymaps import *
import matplotlib.font_manager as fm
from   matplotlib import pyplot as plt


def draw(location:str='Old Town, Tallinn',
         radius:int=1000,
         width:int=12,
         height:int=12):
    fig, ax = plt.subplots(figsize=(width, height),
                           constrained_layout=True)

    backup = plot(
        location,
        radius=radius,
        ax=ax,
        layers = {
            'perimeter': {},
            'streets': {
                'custom_filter':
                    '["highway"~"motorway|trunk|primary|'
                      'secondary|tertiary|residential|service|'
                      'unclassified|pedestrian|footway"]',
                'width': {
                    'motorway': 5,
                    'trunk': 5,
                    'primary': 4.5,
                    'secondary': 4,
                    'tertiary': 3.5,
                    'residential': 3,
                    'service': 2,
                    'unclassified': 2,
                    'pedestrian': 2,
                    'footway': 1,
                }
            },
            'building': {'tags': {'building': True,
                                  'landuse': 'construction'},
                         'union': False},
            'water': {'tags': {'natural': ['water', 'bay']}},
            'green': {'tags': {'landuse': 'grass',
                               'natural': ['island', 'wood'],
                               'leisure': 'park'}},
            'forest': {'tags': {'landuse': 'forest'}},
            'parking': {'tags': {'amenity': 'parking',
                                 'highway': 'pedestrian',
                                 'man_made': 'pier'}}
        },
        drawing_kwargs = {
            'background': {'fc': '#F2F4CB',
                           'ec': '#dadbc1',
                           'hatch': 'ooo...',
                           'zorder': -1},
            'perimeter': {'fc': '#F2F4CB',
                          'ec': '#dadbc1',
                          'lw': 0,
                          'hatch': 'ooo...',
                          'zorder': 0},
            'green': {'fc': '#D0F1BF',
                      'ec': '#2F3737',
                      'lw': 1,
                      'zorder': 1},
            'forest': {'fc': '#64B96A',
                       'ec': '#2F3737',
                       'lw': 1,
                       'zorder': 1},
            'water': {'fc': '#a1e3ff',
                      'ec': '#2F3737',
                      'hatch': 'ooo...',
                      'hatch_c': '#85c9e6',
                      'lw': 1,
                      'zorder': 2},
            'parking': {'fc': '#F2F4CB',
                        'ec': '#2F3737',
                        'lw': 1,
                        'zorder': 3},
            'streets': {'fc': '#2F3737',
                        'ec': '#475657',
                        'alpha': 1,
                        'lw': 0,
                        'zorder': 3},
            'building': {'palette': ['#FFC857',
                                     '#E9724C',
                                     '#C5283D'],
                         'ec': '#2F3737',
                         'lw': .5,
                         'zorder': 4},
        }
    )

    filename = str(uuid.uuid4()).split('-')[0] + '.png'
    plt.savefig(filename)
    print(filename)


if __name__ == "__main__":
    typer.run(draw)
I've wrapped the draw function with typer which has generated a CLI interface for this script.
$ python3 pretty.py --help
Usage: pretty.py [OPTIONS]

Options:
  --location TEXT                 [default: Old Town, Tallinn]
  --radius INTEGER                [default: 1000]
  --width INTEGER                 [default: 12]
  --height INTEGER                [default: 12]
  --install-completion [bash|zsh|fish|powershell|pwsh]
                                  Install completion for the specified shell.
  --show-completion [bash|zsh|fish|powershell|pwsh]
                                  Show completion for the specified shell, to
                                  copy it or customize the installation.
  --help                          Show this message and exit.
The following will render the Old Town of Tallinn as a 600x600-pixel PNG.
$ python3 pretty.py \
    --location='Old Town, Tallinn' \
    --width=6 \
    --height=6
The above produced a file called 89222126.png which is 629 KB in size. I ran this through a PNG crusher and brought the file size down further to 188 KB.
Note, a ~/cache directory will appear in your home folder when you run the above. It'll contain JSON files that are uncompressed and could grow substantially depending on your use of this application.
The following example file contains 222,947 lines when formatted and is 2.7 MB decompressed.
$ cat ~/cache/cd3dadcdd6b03fce64983fa1a369d46009c9f62c.json \
    | jq \
    | head -n20
{
  "version": 0.6,
  "generator": "Overpass API 0.7.58.5 b0c4acbb",
  "osm3s": {
    "timestamp_osm_base": "2022-07-20T17:46:03Z",
    "copyright": "The data included in this document is from www.openstreetmap.org. The data is made available under ODbL."
  },
  "elements": [
    {
      "type": "node",
      "id": 10578470,
      "lat": 59.4320723,
      "lon": 24.7205922
    },
    {
      "type": "node",
      "id": 10578472,
      "lat": 59.428396,
      "lon": 24.7234038
    },
Finally, there is a prettymaps Web UI for anyone not interested in installing and running code.